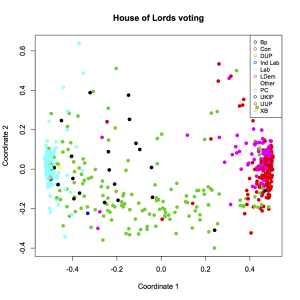
A vector of numbers is a fundamental data representation which forms the basis of very many algorithms in data mining, language processing, machine learning, and visualization. This week we will looked in depth at two things: representing objects as vectors, and clustering them, which might be the most basic thing you can do with this sort of data. This requires a distance metric and a clustering algorithm — both of which involve editorial choices. In journalism we can use clusters to find groups of similar documents, analyze how politicians vote together, or automatically detect groups of crimes.
Slides for week 2 are here.
See also a discussion of (and files for reproducing) the UK House of Lords voting analysis we did in class, this one:
Here are the main references on this material (from the syllabus):
- Cluster Analysis, Wikipedia
- The Challenges of Clustering High Dimensional Data, Steinbach, Ertöz, Kumar
- General purpose computer-assisted clustering and conceptualization, Justin Grimmer, Gary King
- Survey of clustering data mining techniques, Pavel Berkhin
And here are some of the other things we looked at today:
- Interactive K-means clustering demonstration
- The NOMINATE analysis of U.S. congressional voting
- A related analysis of voting, done with a completely different, Bayesian technique
- An Introduction to Multidimensional Scaling
Other uses of clustering in journalism:
- Message Machine, ProPublica
- ‘GOP 5′ make strange bedfellows in budget fight, Chase Davis, California Watch
- Data mining in politics, Aleks Jakulin
- A House Divided, Delaware Online

