Summary & Our Definition of Fairness
Before delving into the data and running any analysis, we determined that our metric for fairness would be based on “equal-opportunity” of being searched, i.e. the question we wanted to answer was: do people who live in certain areas or look a certain way more likely to be searched with no arrest? By certain areas, we mean the population breakdown of precincts, i.e. if a neighbourhood is more skewed towards a certain demographic, does it impact the likelihood of a stop and frisk?
“Disparate impact” in the U.S. Labor Law refers to activities that adversely affect a group of people of a protected characteristic (say race). This can be applied to fairness in stop-and-frisk, i.e. do people of a protected characteristic get more adversely impacted with stop-and-frisk, i.e. are there a lower number of hits?
We decided to break it down by precinct as opposed to census block, as that’s how the NYPD bureaus are divided. The fairness question that this analysis raises is with respect to the police: were the stops fair? And, if not, which precincts were particularly unfair?
Initial Investigation
Initially, before running the linear model, we ran through some basic number crunching to see if there was any evidence of unfairness. Here, we looked at two things:
- Figure 1 shows the hit ratio for violent crimes, by precinct, across blacks, whites, black Hispanics and white Hispanics. Here, we saw that the (twelve) lowest hit ratios were distributed between Black Hispanics (4), Whites (7) and a single white Hispanic.
Further investigation suggested that, for the most part, the hit ratio was at around the 0.05 mark. Interestingly, for some precincts (20, 32, 42, 45, 48), where the hit ratio for non-whites was very low, the hit ratio for Whites was significantly higher.
On the other hand, in some precincts (50, 76, 78), the hit ratio for blacks was much higher than the hit ratio for whites.
Effectively, there was no evidence of unfairness across the board, but if we narrowed it down by precinct, there was evidence of bias.
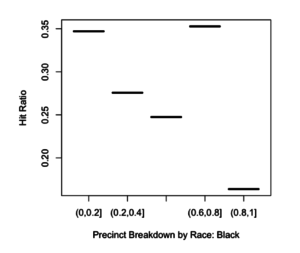
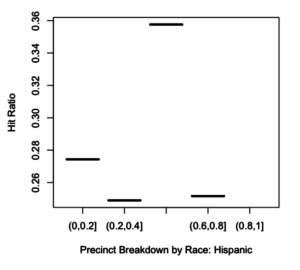
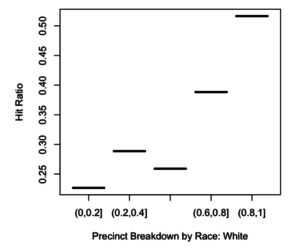
- Figure 2.1, 2.2 and 2.3 plot the hit ratios for blacks against precincts with different racial backgrounds. The idea behind this was: if there is racial bias in a precinct, then the hit rate for blacks in that community will be low. Or, put another way, are people more suspicious of a minority community in their midst for no good reason (which would explain the low hit rate)?
Here, we found that in a predominantly white precinct (where 80-100% of the population was white), the hit ratio for blacks was at 0.11, whereas at a precinct where there were less than 20% whites, the number was at 0.02. But, the hit ratio for whites was, for the most part, constant ~0.08.
In neighbourhoods that were predominantly Hispanic, on the other hand (60-80%), the hit ratio was low at 0.01. Here, the hit rate for whites was ~0.065. However, when there were less than 20% Hispanics, the hit ratio exceeded 0.07. And, for whites, it exceeded 0.08.
Finally, in the hit ratio was high (exceeded 0.08) in precincts where the black population was sub-20% but low (0.01) where over 80% of the population was black.
While these was interesting to note, the numbers weren’t outlandishly skewed, and consequently, there was no obvious bias evident.
Method
We ran two regressions – one on race and one on the likelihood of being detained for a reported interaction in precincts based on the racial makeup of that precinct. The precinct racial makeup data was taken from all NYC2010 census blocks with the precinct, modified by John Keefe.
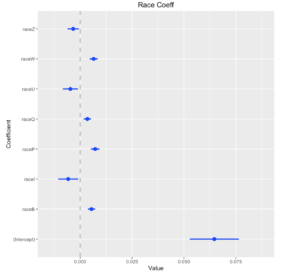
Race coefficients:
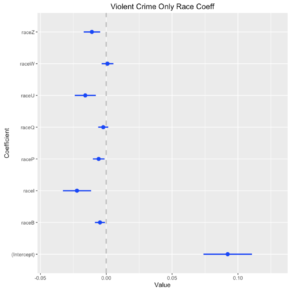
First, we took a look at the differences between race after applying random effects to sex, precinct and age. Our findings show that when looking at all crime, there is not much difference between whites and blacks. Both were slightly more likely than all other races but one (P and Q together form the Hispanic group) to produce a hit. This seems to show that both whites and blacks are policed more reasonably than other races because they produce fewer stops without arrests.
However, when you remove all non-violent crime, whites are the only race where the odds of a stop producing a hit increases. All the heavily represented races (lower std. deviation) converge to zero when we remove non-violent crime, showing that there’s much less disparity. Yet, there still appears to be some racial discrimination toward non-whites.
Precinct coefficients:
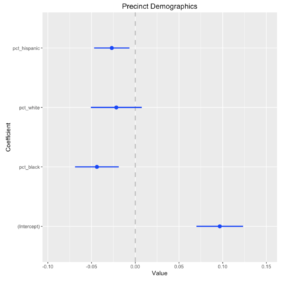
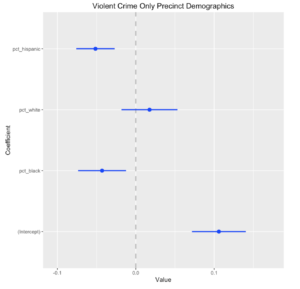
By running a regression on the percentage of each precinct that was of a given race for black, white and Hispanic, we hoped to be able to identify any racial disparities between policing in particular precincts.
Both the violent-only and full set of data seem to show significant differences between whites and blacks. When factoring in non-violent crime, it appears black communities have many more stops without arrests than either the white or the Hispanic communities.
Our findings also seem to show predominantly white communities could use more policing to cut down on violent crime, as stopping a person in a white precinct increases the chances of a hit when only looking at violent crime. However, black and Hispanic communities are pretty much on par with each other with violent-only crime.
Residual effects:
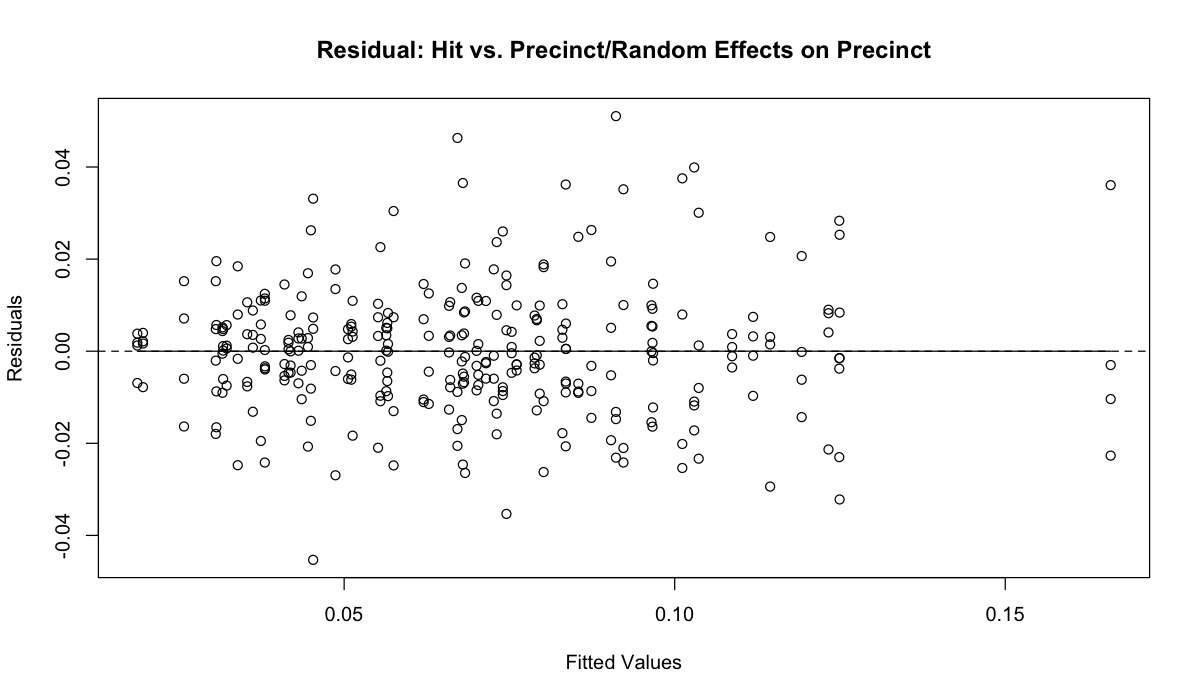
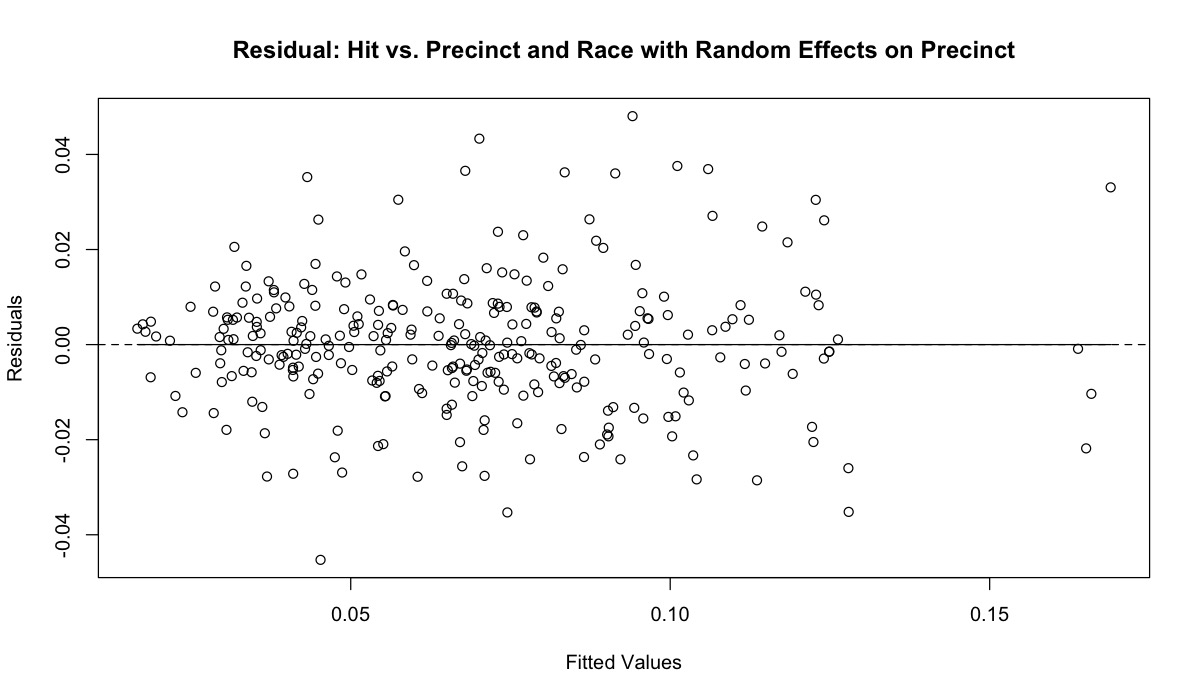
We can see that if we breakdown our LME model by hit ratio vs. the precinct (with random effects on precinct), we get a fairly straight line, indicating that we get a fairly reliable predictor using just the precinct.
What is interesting, though, is that this doesn’t change significantly when we add race to the mix, indicating that using the precinct in isolation doesn’t decrease the reliability of the predictor compared to using a combination of the precinct and race.
There would be no disparate impact if the probability of hits given race is equivalent to the probability of hits when race is absent (i.e. P(hits | race == 1) ≈ P(hits | race == 0)). We can see that this is the case here.
Final thoughts
For the most part, through this exercise, we didn’t see a lot of bias in policing. There is evidence that some precinct are more biased – or more unfair – than others, using our definition of “unfairness”, but not enough where we can claim there is systematic bias.
The residual effects chart is probably the most interesting, as it seems to indicate that throwing race into the mix doesn’t improve predictability – but, that could be explained by bias already being built into the precinct. Or, because, policing had become more careful in the early 2010s after the accusations of bias in the mid-to-late noughties.


