Aims of the course
The aim of the course is to familiarise students with current areas of research and development within computer science that have a direct relevance to the field of journalism. We are interested in producing both stories and software: we will study advanced techniques which can be used for individual acts of journalism, but we will also be studying the design of the software systems which inform us all.
Our scope is wide enough to include both relatively traditional journalistic work, such as computer-assisted investigative reporting, and the broader information systems that we all use every day to inform ourselves, such as search engines. The course will provide students with a thorough understanding of how particular fields of computational research relate to products being developed for journalism, and provoke ideas for their own research and projects.
Research-level computer science material will be discussed in class, but the emphasis will be on understanding the capabilities and limitations of this technology. Students with a CS background will have opportunity for algorithmic exploration and innovation, however the primary goal of the course is thoughtful, application-oriented research and design.
Assignments will be completed in groups and involve experimentation with fundamental computational techniques. There will be some coding, but the emphasis will be on thoughtful and critical analysis. As this is a journalism course, you will be expected to write clearly.
Format of the class, grading and assignments.
This is a fourteen week course for Masters’ students which has both a six point and a three point version. The six point version is designed for dual degree candidates in the journalism and computer science concentration, while the three point version is designed for those cross listing from other concentrations and schools.
The class is conducted in a seminar format. Assigned readings and computational techniques will form the basis of class discussion. Throughout the semester we will invite guest speakers with expertise in the relevant areas to talk about their related journalism, research, and product development
The course will be a graded as follows:
- Assignments: 60%. There will be a homework assignment after most classes.
- Class participation: 10%
- Final project (for dual degree students only): 30%. This will be either a research paper, a computationally-driven story, or a software project.
The class is conducted on pass/fail basis for journalism students, in line with the journalism school’s grading system. Students from other departments will receive a letter grade.
Week 1. – Basics
First we ask: where do computer science and journalism intersect? CS techniques can help journalism in four different areas: data-driven reporting, story presentation, information filtering, and effect tracking. Then we jump right in with the concept of data. Specifically, we study feature vectors which are a fundamental data representation for many algorithms in data mining, language processing, machine learning, and visualization. This week we will explore two things: representing objects as vectors, and visualizing high dimensional spaces.
Required
Recommended
- Precision Journalism, Ch.1, Journalism and the Scientific Tradition, Philip Meyer
Viewed in class
Lecture 2: Text Analysis
Can we use machines to help us understand text? In this class we will cover basic text analysis techniques, from word counting to topic modeling. The algorithms we will discuss this week are used in just about everything: search engines, document set visualization, figuring out when two different articles are about the same story, finding trending topics. The vector space document model is fundamental to algorithmic handling of news content, and we will need it to understand how just about every filtering and personalization system works.
Required
- Online Natural Language Processing Course, Stanford University
- Week 7: Information Retrieval, Term-Document Incidence Matrix
- Week 7: Ranked Information Retrieval, Introducing Ranked Retrieval
- Week 7: Ranked Information Retrieval, Term Frequency Weighting
- Week 7: Ranked Information Retrieval, Inverse Document Frequency Weighting
- Week 7: Ranked Information Retrieval, TF-IDF weighting
Recommended
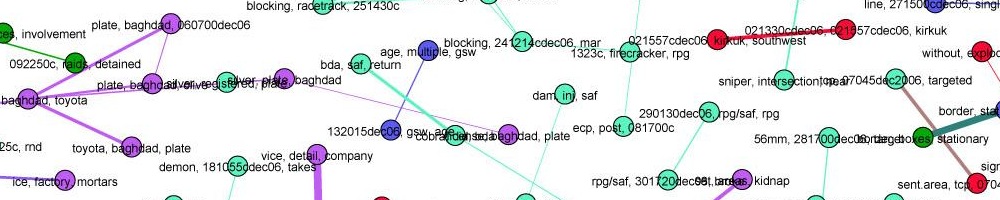
- A full-text visualization of the Iraq war logs, Jonathan Stray
- Introduction to Information Retrieval Chapter 6, Scoring, Term Weighting, and The Vector Space Model, Manning, Raghavan, and Schütze.
- Probabilistic Topic Models, David M. Blei
- General purpose computer-assisted clustering and conceptualization, Justin Grimmer, Gary King
Examples
Assignment: TF-IDF analysis of State of the Union speeches.
Week 3: Information overload and algorithmic filtering
This week we begin our study of filtering with some basic ideas about its role in journalism. Then we shift gears to pure algorithmic approaches to filtering, with a look at how the Newsblaster system works (similar to Google News.)
Required
Recommended
Week 4: Social software and social filtering
We have now studied purely algorithmic modes of filtering, and this week we will bring in the social. First we’ll look at the entire concept of “social software,” which is a new interdisciplinary field with its own dynamics. We’ll use the metaphor of “architecture,” suggested by Joel Spolsky, to think about how software influences behaviour. Then we’ll study social media and its role in journalism, including its role in information distribution and collection, and emerging techniques to help find sources.
Required
Recommended
- Learning from Stackoverflow, first fifteen minutes, Joel Spolsky
- Norms, Laws, and Code, Jonathan Stray
- What is Twitter, a Social Network or a News Media?, Haewoon Kwak, et al,
- International reporting in the age of participatory media, Ethan Zuckerman
- We The Media. Introduction and Chapter 1, Dan Gillmor,
- Are we stuck in filter bubbles? Here are five potential paths out, Jonathan Stray
Week 5: Hybrid filters, recommendation, and conversation
We have now studied purely algorithmic and mostly social modes of filtering. This week we’re going to study systems that combine software and people. We’ll a look “recommendation” systems and the socially-driven algorithms behind them. Then we’ll turn to online discussions, and hybrid techniques for ensuring a “good conversation” — a social outcome with no single definition. We’ll finish by looking at an example of using human preferences to drive machine learning algorithms: Google Web search.
Required
Recommended
Assignment – Design a filtering algorithm for status updates.
Week 6: Visualization
An introduction into how visualisation helps people interpret information. The difference between infographics and visualization, and between exploration and presentation. Design principles from user experience considerations, graphic design, and the study of the human visual system. Also, what is specific about visualization in journalism, as opposed to the many other fields that use it?
Required
Recommended
Week 7: Structured journalism and knowledge representation
Is journalism in the text/video/audio business, or is it in the knowledge business? This class we’ll look at this question in detail, which gets us deep into the issue of how knowledge is represented in a computer. The traditional relational database model is often inappropriate for journalistic work, so we’re going to concentrate on so-called “linked data” representations. Such representations are widely used and increasingly popular. For example Google recently released the Knowledge Graph. But generating this kind of data from unstructured text is still very tricky, as we’ll see when we look at th Reverb algorithm.
Required
Recommended
Assignment: Text enrichment experiments using OpenCalais entity extraction.
Week 8: Network analysis
Network analysis (aka social network analysis, link analysis) is a promising and popular technique for uncovering relationships between diverse individuals and organizations. It is widely used in intelligence and law enforcement, but not so much in journalism. We’ll look at basic techniques and algorithms and try to understand the promise — and the many practical problems.
Required
Recommended
Examples:
Assignment: Compare different centrality metrics in Gephi.
Week 9: Drawing conclusions from data
You’ve loaded up all the data. You’ve run the algorithms. You’ve completed your analysis. But how do you know that you are right? It’s incredibly easy to fool yourself, but fortunately, there is a long history of fields grappling with the problem of determining truth in the face of uncertainty, from statistics to intelligence analysis.
Required
Recommended
Assignment: analyze gun ownership vs. gun violence data.
Week 10: Security, Surveillance, and Censorship
Who is watching our online activities? How do you protect a source in the 21st Century? Who gets to access to all of this mass intelligence, and what does the ability to survey everything all the time mean both practically and ethically for journalism? In this lecture we will talk about who is watching and how, and how to create a security plan using threat modeling.
Required
Recommended
Cryptographic security
Anonymity
Assignment: Use threat modeling to come up with a security plan for a given scenario.
Week 11: Tracking flow and impact
How does information flow in the online ecosystem? What happens to a story after it’s published? How do items spread through social networks? We’re just beginning to be able to track ideas as they move through the network, by combining techniques from social network analysis and bioinformatics.
Required
Recommended
Week 12 – Project review
We will spend this week discussing your final projects and figuring out the best approaches to your data and/or topic.