In this week’s class, we discussed clustering algorithms and their application to journalism. As an example, we built a distance metric to measure the similarity of the voting history between two members of the UK House of Lords, and used it with multi-dimensional scaling to visualize the voting blocs.
The data comes from The Public Whip, an independent site that scrapes the British parliamentary proceedings (the “hansard“) and extracts the voting record into a database. The files for the House of Lords are here. They’re tab-delimited, which is not the easiest format for R to read, so I opened them in Excel and re-saved as CSV. I also removed the descriptive header information from votematrix-lords.txt (which, crucially, explains how the vote data is formatted.)
The converted data files plus the scripts I used in class are up on GitHub. To get them running, first you’ll need to install R for your system. Then you’ll need the “proxy” package, which I have conveniently included with the files. To install proxy: on WIndows, “R CMD INSTALL proxy_0.4-9.zip” from the command line. On Mac, “R CMD INSTALL proxy_0.4-9.tgz” from Terminal.
Then start R, and enter source(“lords-votes.R”)
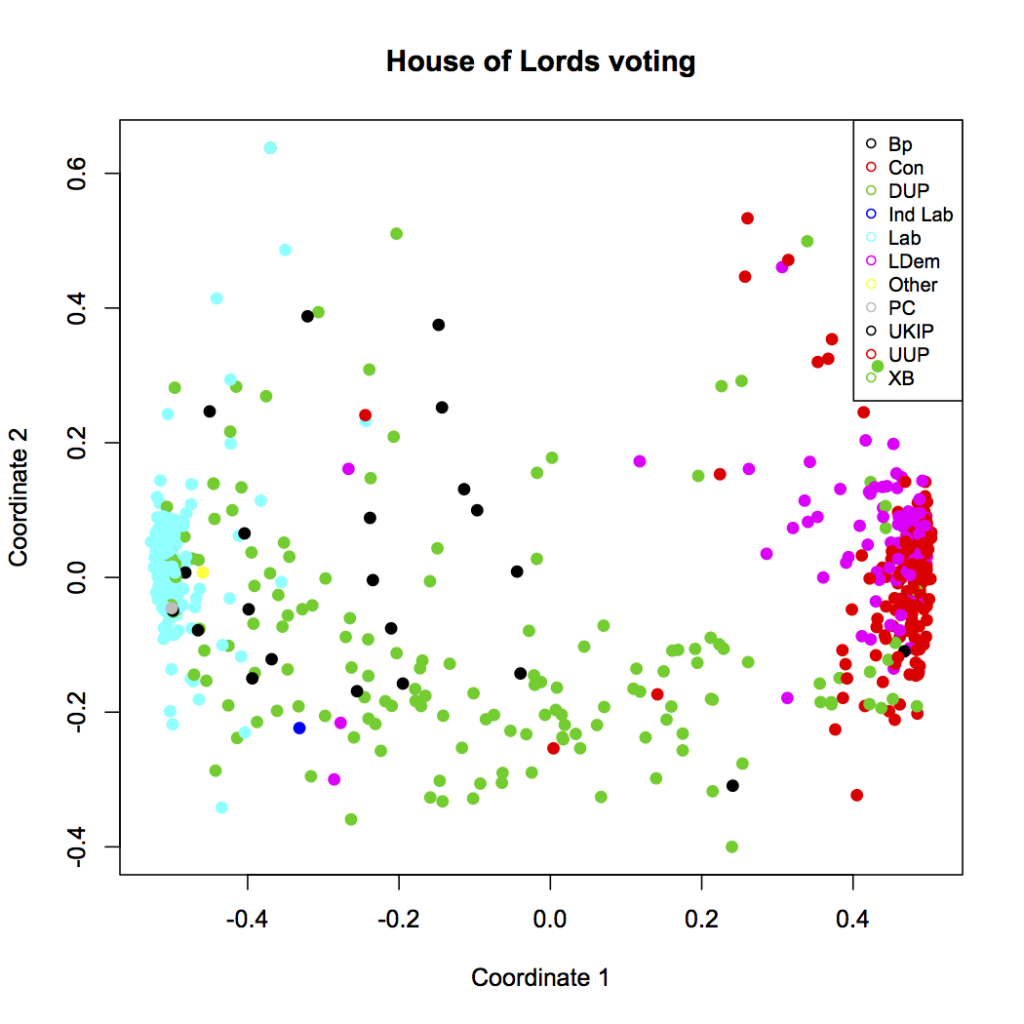
You should see this (click for larger):
 And voila! There’s a lot of structure here. The blue cluster on the left are all the lords of the Labor party. The red dots in the cluster on the right are likewise members of the Conservative party, who are currently in a coalition government with Liberal Democrats — magenta, and mostly overlapping the conservative cluster. The green dots throughout the figure are the crossbenchers, and we can see that they really are indpendent. The scattered black dots are the Bishops, who don’t seem to vote together or, really, quite like anyone else, but are vaguely leftist.
Let’s break down how we made this plot — which will also illuminate how to interpret it, and how much editorial choice went into its construction. No visualization is gospel, though, as we shall see, there are reasons to believe that what this one is telling us is accurate.
The first section of lords-votes.R just loads in the data, and convers the weird encoding (2=aye, 4=nay, -9=not present, etc.) into a matrix of 1 for aye, -1 for nay, and 0 did not vote. The votes matrix ends up with 1043 rows, each of which contains the votes cast by a single Lord on 1630 occasions.
The next section truncates this to the 100 most recent votes. The 1630 votes in this file go back to 1999, and the voting patterns might have changed substantially over that time. Besides, over 200 Lords have retired since then. So we arbitrarily drop all but the last 100 votes, which gives a period of voting history stretching back to mid-November 2011. A more sophisticated analysis could look at how the voting blocs might have varied over time.
Then we get to the distance function, which is the heart of the code. We have to write a function that takes two vectors of votes, representing the voting history of two Lords, and returns the “distance” between them. This function can take any form but it has to obey the definition of a distance metric. That definition says zero means “identical,” but doesn’t put any constraint on the maximum “distance” between Lords. For simplicity and numerical stability, we’ll say the distance varies from zero (identical voting) to one (no votes in common.)
For our distance function, we just count the fraction of votes where Lord 1 and Lord 2 voted the same (or rather, one minus this fraction, so identical = zero.) Except that not every Lord voted on every issue. So, we first find the overlap of issues where they both voted, and then count their identical votes on that subset. (If there is no overlap, we return 1, i.e. as far apart as possible)
# distance function = 1 - fraction of votes where both voted, and both voted the same
votedist <- function(v1, v2) {
   overlap = v1!=0 & v2!=0
   numoverlap = sum(overlap)
   match = overlap & v1==v2
   nummatch = sum(match)
   if (!numoverlap)
      dist = 1
   else
      dist = 1- (nummatch/numoverlap)
   dist
}
With this distance function in hand, we can create a distance matrix. In the final section of the script, we pass this distance function to R’s built-in multi-dimensional scaling function, mdscale. And then we plot, using the party as a color. That plot again:
And there we are, with our voting blocs: Labour (blue), Conservative (red) with Liberal Democrats (magenta), the crossbenchers (green), and the Bishops (black).
But now we have to step back and ask — is this “objective”? Is this “real”? The plot seems like it comes right from the data, but consider: we wrote a distance function. There’s no particular reason our little distance function is the “right” way to compare Lords, journalistically speaking. We also decided to use multidimensional scaling here, whereas there are other techniques for visualizing voting spatially, such as the well known NOMINATE algorithm.
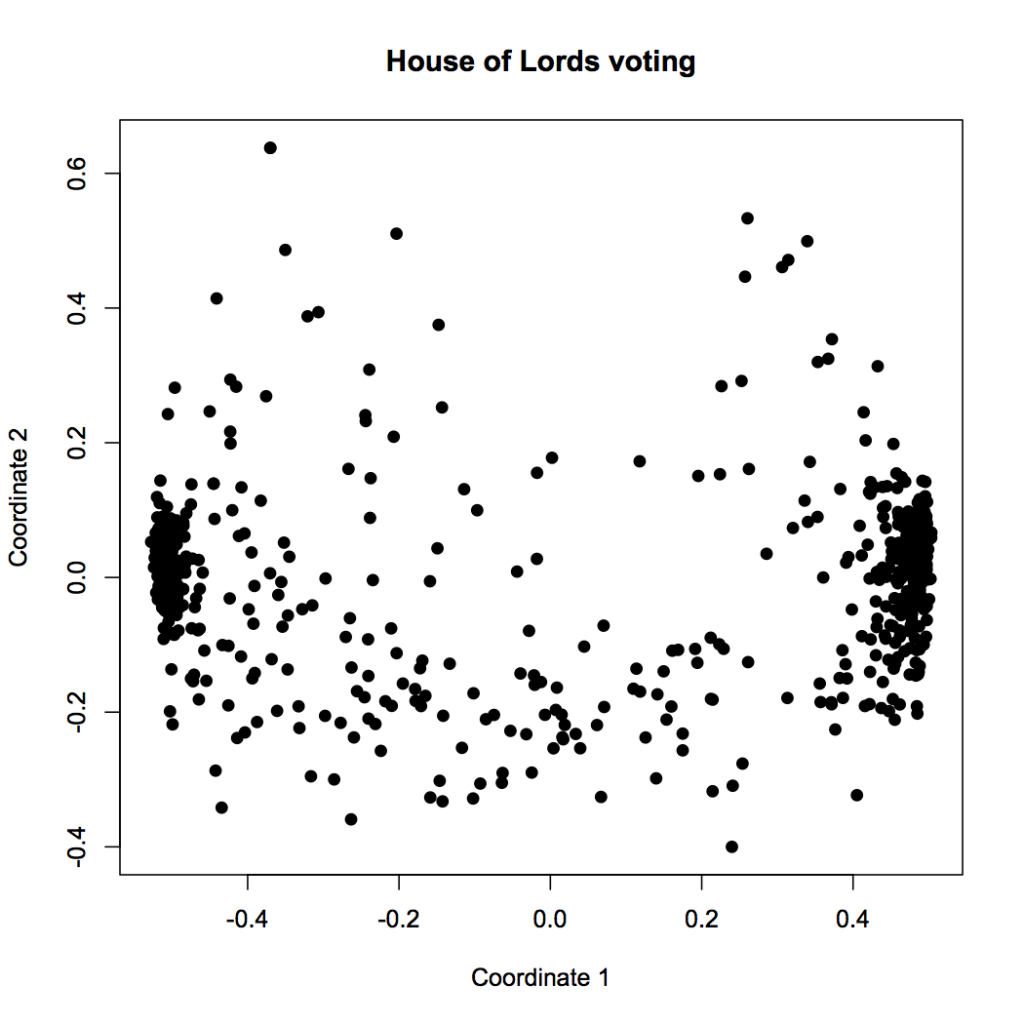
Also, the chart is very abstract. There seems to be a clear left-right axis, but what does the vertical axis mean? We know that MDS tries to keep distant points far away, so something is driving the dots near the top of the chart away from the others… but what does this really mean? Consider that we’ve already added a layer of interpretation by coloring by party affiliation; here’s the same chart without the color:
A lot less clear, isn’t it? Yes, our clustering tricks made us a chart, but to understand what it means, we have to supply context from outside the data. In this case, we know that voting behavior likely has a lot to do with party affiliation, so we chose to use party as an indpendent variable. You can think of it like this: in the colored plot, we’re graphing party against clustered coordinate. The fact that the clusters have clear solid colors means that, as we suspected, party is strongly correlated with voting history. The fact that Labor and Conservative are on opposite ends also makes sense, because we already imagine them to be on different ends of the political spectrum.
But what about the vertical axis? It doesn’t seem to correlate particularly well with party. What does it mean? Well, we’d have to dig into the data to see what the distance function and MDS algorithm have done here, and try to come up with an explanation. (And actually, the second dimension may not mean much at all — there is good evidence, from the NOMINATE research, that at least American voting behavior is typically only one-dimensional.)
In other words, it’s the human that interprets the plot, not the computer. The description at the start of this post of what this visualization tells us — the computer didn’t write that.
Let’s try a different distance function to see the effect of this piece of the algorithm. Our current distance function ignores the total number of votes where both Lords were present. If two Lords only voted on the same issue once, but they voted the same way, it will still score them as identical. That doesn’t seem quite right.
So let’s modify the crucial line of the distance function to penalize voting histories that don’t overlap much. (You can try this yourself by uncommenting line 47 in lords-votes.r)
dist = 1- ((nummatch/numoverlap) * log(numoverlap)/log(Nvotes))
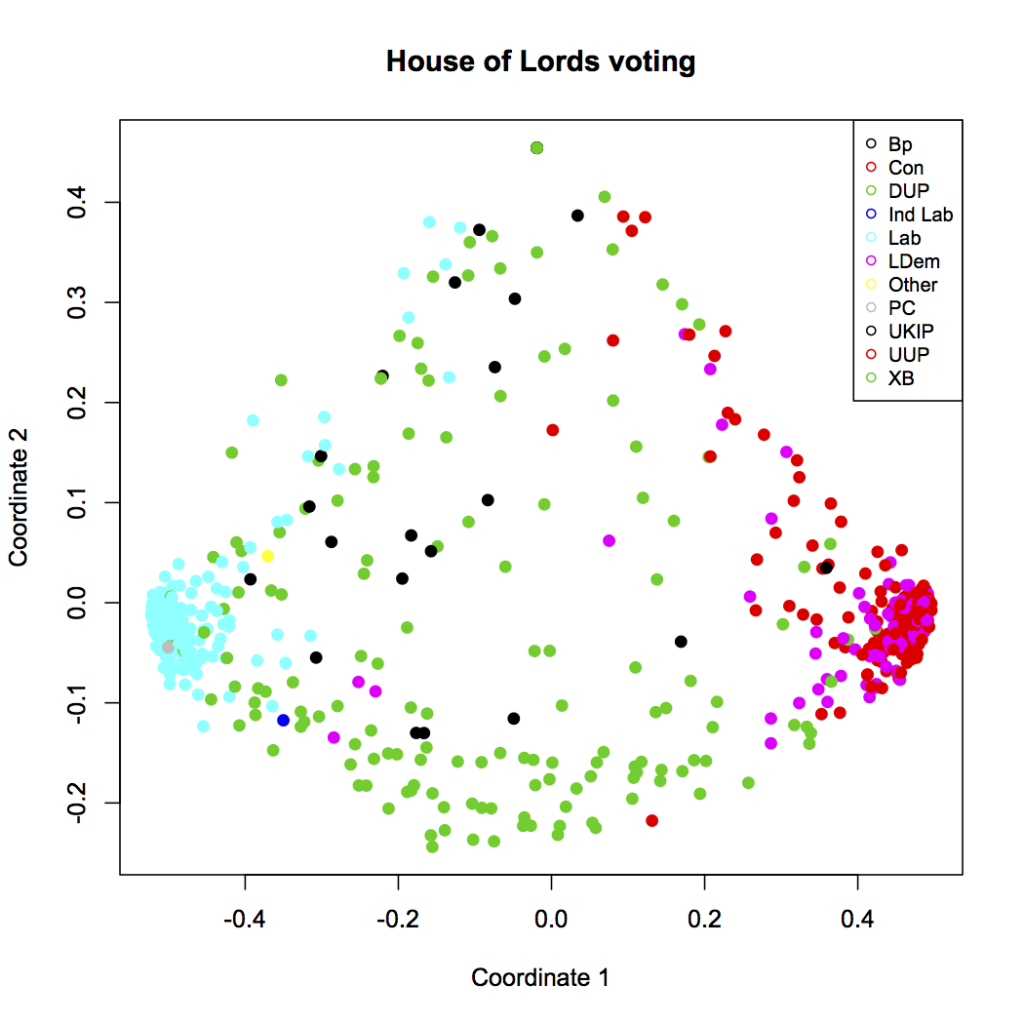
I’ve multiplied the fraction of matching votes by the fraction of issues that both Lords voted on (out of the possible Nvotes=100 most recent issues that we’re looking at.) I’ve also put a logarithm in there to compress the scale, because I want going from 5 to 10 votes to count more than going from 95 to 100 votes. This is all just made up, right out of my head, on the intuition that I want the distances to get large when there aren’t really enough overlapping votes to really say if two Lords are voting similarly or not. The resulting plot looks like this:
A bunch of Lords have been pushed up near the top of the diagram — away from everything else. These must be the Lords who didn’t participate in many votes, so our distance function says they’re not that close to anyone, really. But the general structure is preserved. This is a good sign. If what the visualization tells us is similar even when we try it lots of different ways, the result is robust and probably real. And I certainly recommend looking at your data lots of different ways — if you just pick the first chart that shows what you wanted to say anyway, that’s not journalism, it’s confirmation bias.
I want to leave you with one final thought, something even more fundamental than the choice of distance function or visualization algorithm: is voting record really the best way to see how politicians operate? What about all the other things they do? We could equally well ask about legislation they’ve drafted or the committees they’ve participated in. (We could even imagine defining a distance function based on the topics of the legislation that each representative has contributed to shaping.) As always, the first editorial choice is where to look.


