For this assignment you will analyze a social network using three different centrality algorithms, and compare the results.
1. Download and install Gephi, a free graph analysis package. It is open source and runs on any OS.
2. Download the data file lesmis.gml from the UCI Network Data Repository. This is a network extracted from the famous French novel Les Miserables — you may also be familiar with the musical and the recent movie. Each node is a character, and there is an edge between two characters if they appear in the same chapter. Les Miserables is written in over 300 short chapters, so two characters that appear in the same chapter are very likely to meet or talk in the plot of the book. The edges are weighted, and the weight is the number of chapters those characters appear together in.
3. Open this file in Gephi, by choosing File->Open. When the dialog box comes up, set the “Graph Type” type to “Undirected.” The graph will be plotted. What do you see? Can you discern any patterns?
4. Now arrange the nodes in a nicer way, by choosing the “Force Atlas 2″ layout algorithm from the Layout menu at left and pressing the “Run” button. When things settle down, hit the “Stop” button. The graph will be arranged nicely, but it will be quite small. You can zoom in using the mouse wheel (or two fingers on the trackpad on a mac) and pan using the right mouse button.
5. Select the “Edit” tool from the bottom of the toolbar on the left. It looks like a mouse pointer with question mark next to it:
![]()
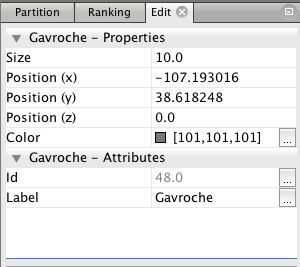
6. Now you can click on any node to see its label, which is the name of the character it represents. This information will appear in the “Edit” menu in the upper left. Here’s the information for the character Gavroche.

Click around the various nodes in the graph. Which characters have been given the most central locations? If you are familiar with the story of Les Miserables, how does this correspond to the plot? Are the most central nodes the most important characters?
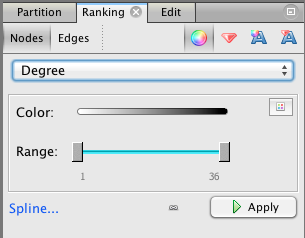
7. Make Gephi color nodes by degree. Choose the “Ranking” tab from panel at the upper left, then select the “Nodes” tab, then “Degree” from the drop-down menu. Press the “Apply” button.

Now the nodes with the highest degree will be darker. Do these high degree nodes correspond to the nodes that the layout algorithm put in the center? Are they the main characters in the story?
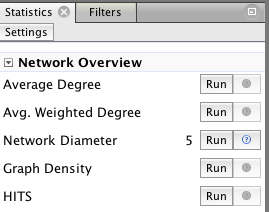
8. Now make Gephi compute betweenness and closeness centrality by pressing the “Run” button for the Network Diameter option under “Network Overview” in to the right of the screen.

You will get a report with some graphs. Just click “Close”. Now betweenness and closeness centrality will appear in the drop-down under “Ranking,” in the same place where you selected degree centrality earlier, and you can assign colors based on either run by clicking the “Apply” button.
Also, the numerical values for betweenness centrality and closeness centrality will now appear in the “Edit” window for each node.
Select “Betweenness Centrality” from the drop-down meny and hit “Apply.” What do you see? Which characters are marked as important? How does it differ from the characters which are marked as important by degree?
Now select “Closeness Centrality” and hit “Apply.” (Note that this metric uses a scale which is the reverse of the others — closeness measures average distance to all other nodes, so small values indicate more central nodes. You may want to swap the black and white endpoints of the color scale to get something which is comparable to the other visualizations.) How does closeness centrality differ from betweeness centrality and degree? Which characters differ between closeness and the other metrics?
9. Which centrality algorithm would you prefer to use to understand the structure of Les Miserables? Why? How would you validate your choice if you didn’t already know the story? That is the situation a journalist is in when they analyze unknown data.
10. Turn in: your answers to the questions in steps 3, 6, 7, 8 and 9, plus screenshots for the graph plotted with degree, betweenness centrality, and closeness centrality. (To take a screenshot: on Windows, use the Snipping Tool. On Mac, press ⌘ Cmd + ⇧ Shift + 4. If you’re on Linux, you get to tell me)
What I am interested in here is how the values computed by the different algorithms correspond to the plot of Les Miserables (if you are familiar with it), and how they compare to each other. Telling me that “Jean Valjean has a closeness centrality of X” is not a high-enough level interpretation — your couldn’t publish that in a finished story, because your readers won’t know what that means.
Due before class on Friday, December 2
